Note: We understand an important tool often used in translational neuroscience research to measure and analyze activity in the brain – EEG. The basics of the methodology and some research examples are discussed below.
Unlike a car, when it breaks down, we dismantle it, figure out the cause of the problem and repair it. Now since we cannot cut open a brain every time we want to treat it, there are non-invasive methods that help us diagnose and guide treatments when the brain malfunctions. One such method is via measuring the electrical activity in the brain, using a device called Electroencephalography (EEG).
The brain contains special cells called neurons that communicate via electrical impulses. One neuron communicates with another through an action potential, that includes the release of chemicals known as neurotransmitters at the junction (synapse), which are then absorbed by the receiving neuron, creating a postsynaptic potential.
EEG uses electrodes placed on the scalp to catch these electrical signals sourced by a group of underlying neurons, and are popularly read in terms of potentials in time space or in frequency space. We can understand concepts of neural oscillations, rhythmic brain activity, brain waves through the time-frequency spectrum (Fig.1).
EEG recordings quantify brain activity in terms of frequency, the number of waves emitted per second, referred to as frequency of waves and measured as Hertz. Some of the predominant frequencies studied are – alpha, beta, theta and delta gamma; representing a different number of waves per second. Disturbances in regularities of such frequencies in time and space can help study different neurological/psychiatric conditions. For example, below is a picture representing commonly observed disturbance patterns in the frequency of waves in epilepsy conditions (Fig. 2).
One interesting way to study the spatio-temporal patterns is through micro-states.The brain also shows brief, stable patterns of activity across the scalp that last for a few milliseconds, called micro-states. Think of it like a movie frame staying stable for a period of 60-120 msecs and then switching. Each of these patterns reflects a different set of brain regions working together at that instant. Further analyzing these microstates help determine the behind-the-scenes of any large scale neuronal network pattern such as resting state network, default mode network.

Event Related Potential
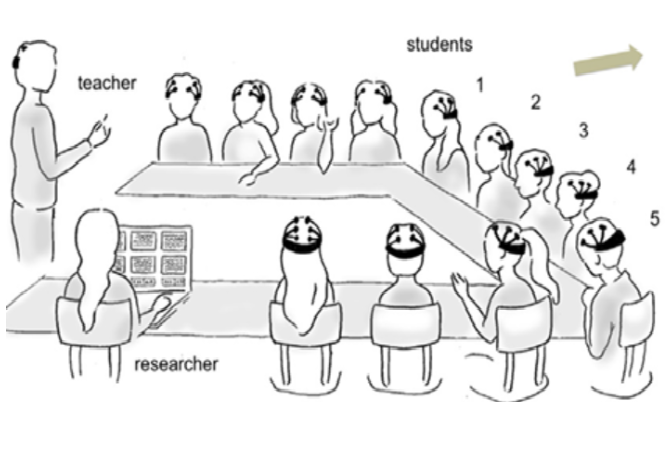
EEG is also used to study Event Related Potential - brain responses time-locked to specific events such as impulse control, hearing a particular sound or reading a word. ERPs are measured by recording EEG while an individual performs a specific task, generally computerized, repeatedly. In real classrooms, EEG can even capture how synchronized students’ brainwaves are with one another, something called "brain-to-brain synchrony" (Fig. 3). A study found that when students were more focused and engaged, their brain activity literally aligned, reflecting shared attention and social connection (Dikker et al., 2017).
Going back to the EEG setup: The electrodes may be distributed across brain areas such as frontal, parietal, occipital and temporal, following standardised placement systems to help establish reproducibility and comparability of recordings across studies. Signals recorded from these sites may largely be then associated with different brain functions – visual, auditory, sensorimotor, and other cognitive functions.
However, simply placing electrodes is not enough, how they are arranged and compared determines what patterns can actually be detected. This is where EEG Montages come in.
Montages
It is important to have an internationally standardized system for placement of electrodes – called montages, since different people have different head sizes, and to capture and interpret the electric activity of the brain effectively. Montages are logical arrangements of electrodes designed for the purpose of detection of – lateralization (compare electrical activity across left and right side of brain) and localization (pin down electrical activity to specific brain regions).
For example, one such montage is the 10-20 system, where two base points (small bump at back of head) and nasion (top of nose bridge between eyes) and 2 preauricular (in front of ear) points are taken as landmarks. You then divide the electrodes on both sides of the head and place them in increments of 10 and 20% of distances relative to each other. Each electrode’s placement is then mapped according to the brain region where it is placed – frontal, parietal, temporal, occipital, central, (e.g. Fp1, P3, T5, O2, Fz1). The numbers represent which side of the brain the electrode is placed (odds on left, evens on right).
Another system called the double banana/ bipolar, is essentially following a chain of electrodes in the left, right and central parts of the scalp (Fig. 6). Here, each electrode is linked and compared to the one behind it. The arrangement forms banana shapes on both hemispheres, hence the name. This montage traces the electrical activity by comparing voltage difference between pairs of electrodes; helping compare spread and direction of electrical activity.
Other EEG montages include longitudinal, transverse, referential, Laplacian, and circumferential arrangements. The choice depends on the interest in localizing to a sourceregion of interest and the type of research question/clinical application being investigated.Similarly, the number and selection of EEG channels depend on the purpose of the study or clinical application, the specific region of interest or kind of analysis, and other practical constraints such as cost and time of setting up 19-20/64/256 channels.
To understand how EEG signals arise, it is helpful to consider the concept of a dipole.
Dipole:
At rest, there is more negative electrical potential within a neuron (-70 mV), and a higher positive charge outside the cell, essentially creating this electric polarity. One can refer to the action potential diagram below:
During an postsynaptic potential (excitatory), a cell depolarizes, leading to extracellular current flows around the neuron, which is what an EEG can pick up, voltages outside the cell. This postsynaptic potential creates a dipole – negative and positive charge at the same time around the cell; equal and opposite charge separated by space and representative of the direction of communication. EEG interpretation relies on dipole models to infer the strength, orientation, and source of neural activity.
Since measuring one cell’s electrical activity is not possible from outside the scalp, an EEG records a summation of such electrical activity across neurons. This is also complicated by the type of cells near the surface of the brain vs in the interiors and the arrangement of these cells. The EEG signal is therefore dominated by the synchronous activity of large populations of aligned cortical pyramidal neurons.
Voltages spread through the brain by “volume conduction” effect. This also leads to a significant amount of degeneracy in signals read across the scalp through EEG. One requires carefully crafted processing pipelines for any task to tap at the precise signals conveyed by a source.
Methods like event related potentials, event related spectral perturbation analysis, connectivity analysis, time and space embeddings, forward models, source localization through any inverse optimizations, non-linear dynamic analysis, are some ways to explore this space further and decode the language of the brain communication.